
7SIG TECHNOLOGIES
Dashboard portfolio
Explore dashboard and reporting examples for sales, finance and business operations. Select a project to see its full-size preview.
29 dashboard and reporting samples
Featured Dashboards
Six selected examples of sales, finance and management reporting.
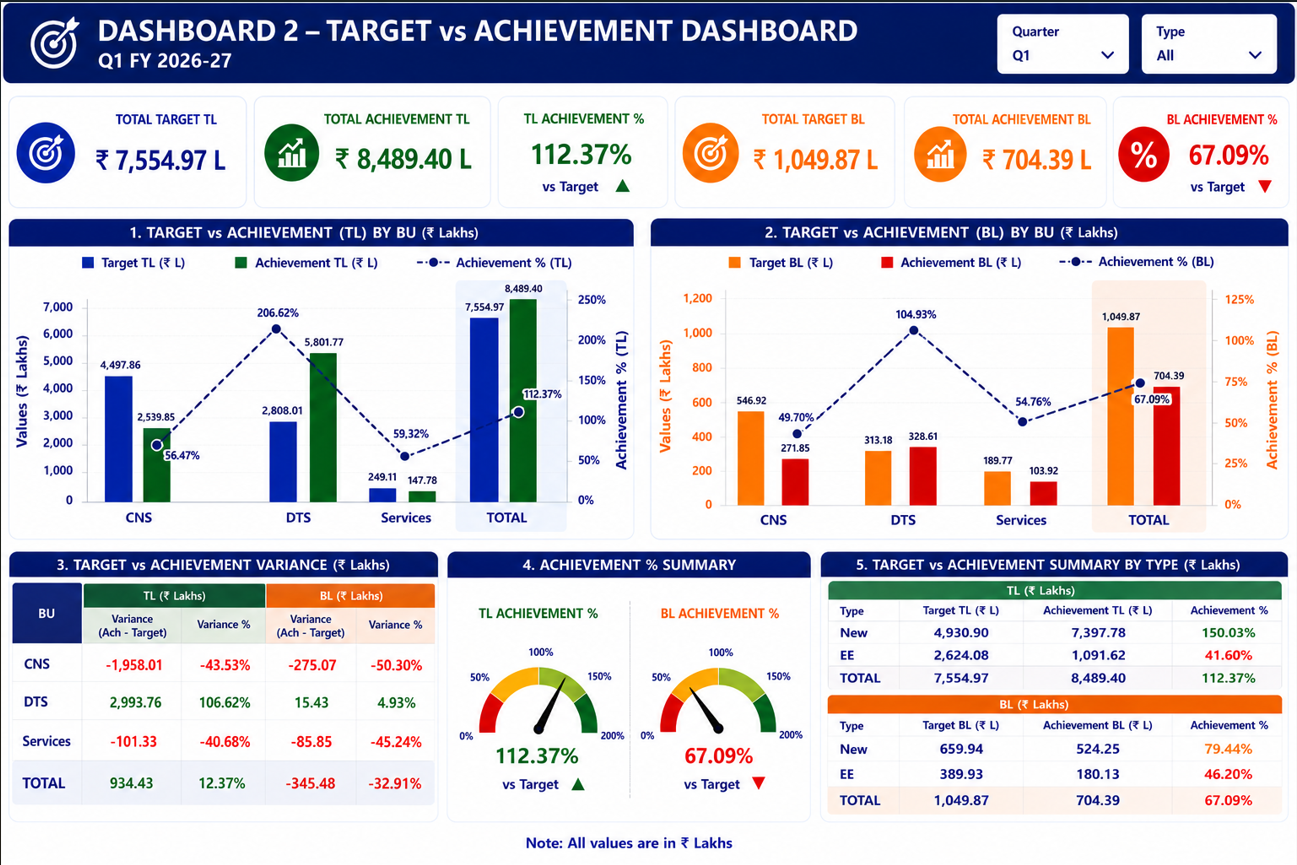
Target vs Achievement Dashboard
Project details
Track sales and gross margin against targets, business unit variances and achievement percentages.
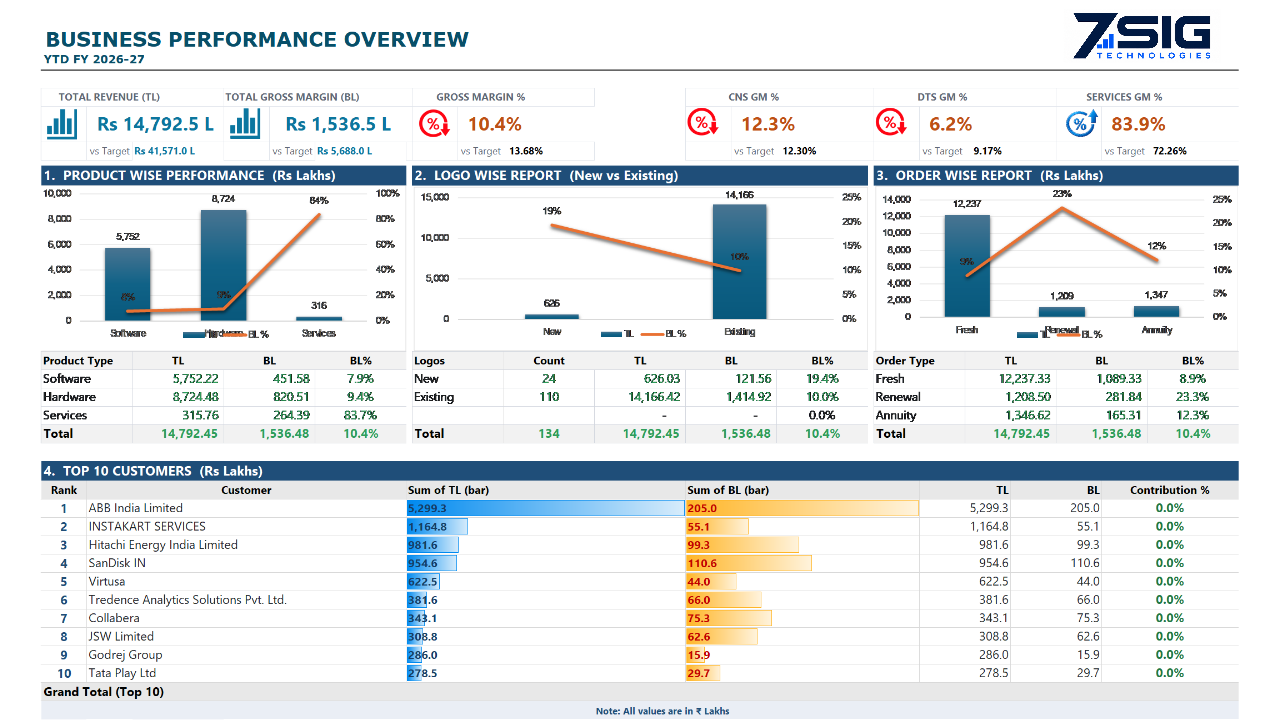
YTD Business Performance Overview
Project details
Management reporting view from the August presentation, covering performance, targets or pipeline.
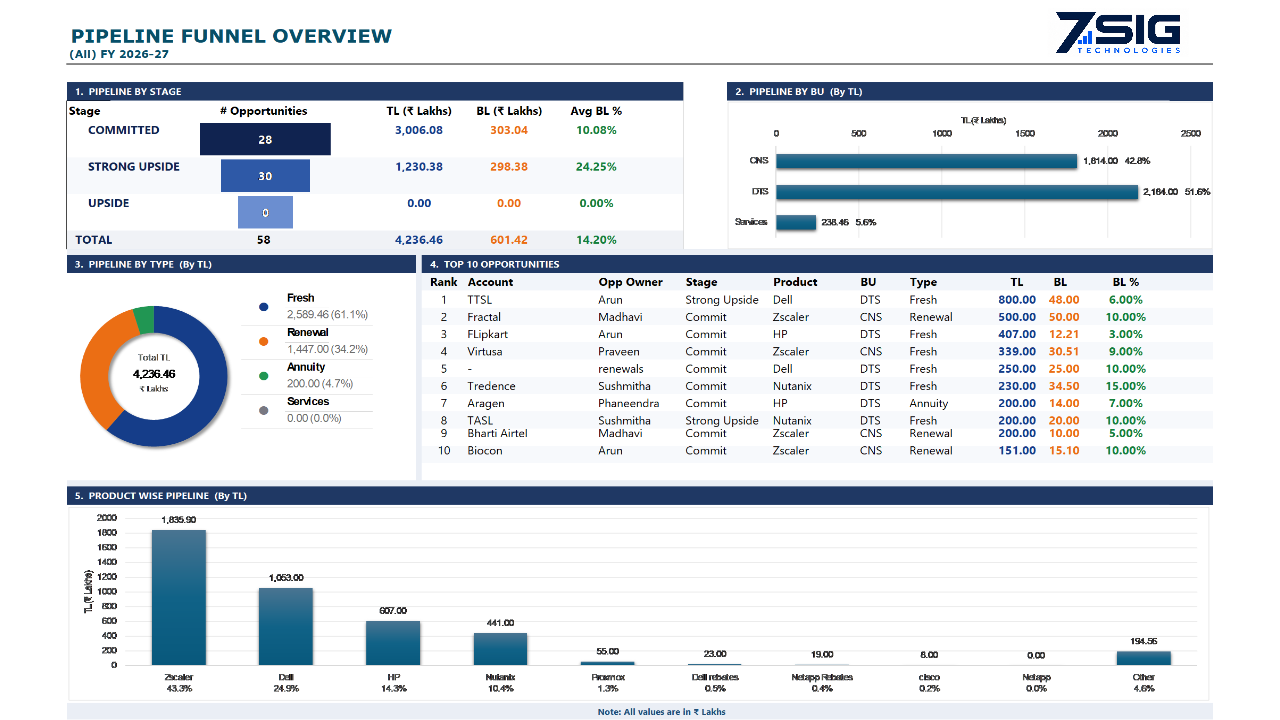
Sales Pipeline Funnel
Project details
Management reporting view from the August presentation, covering performance, targets or pipeline.
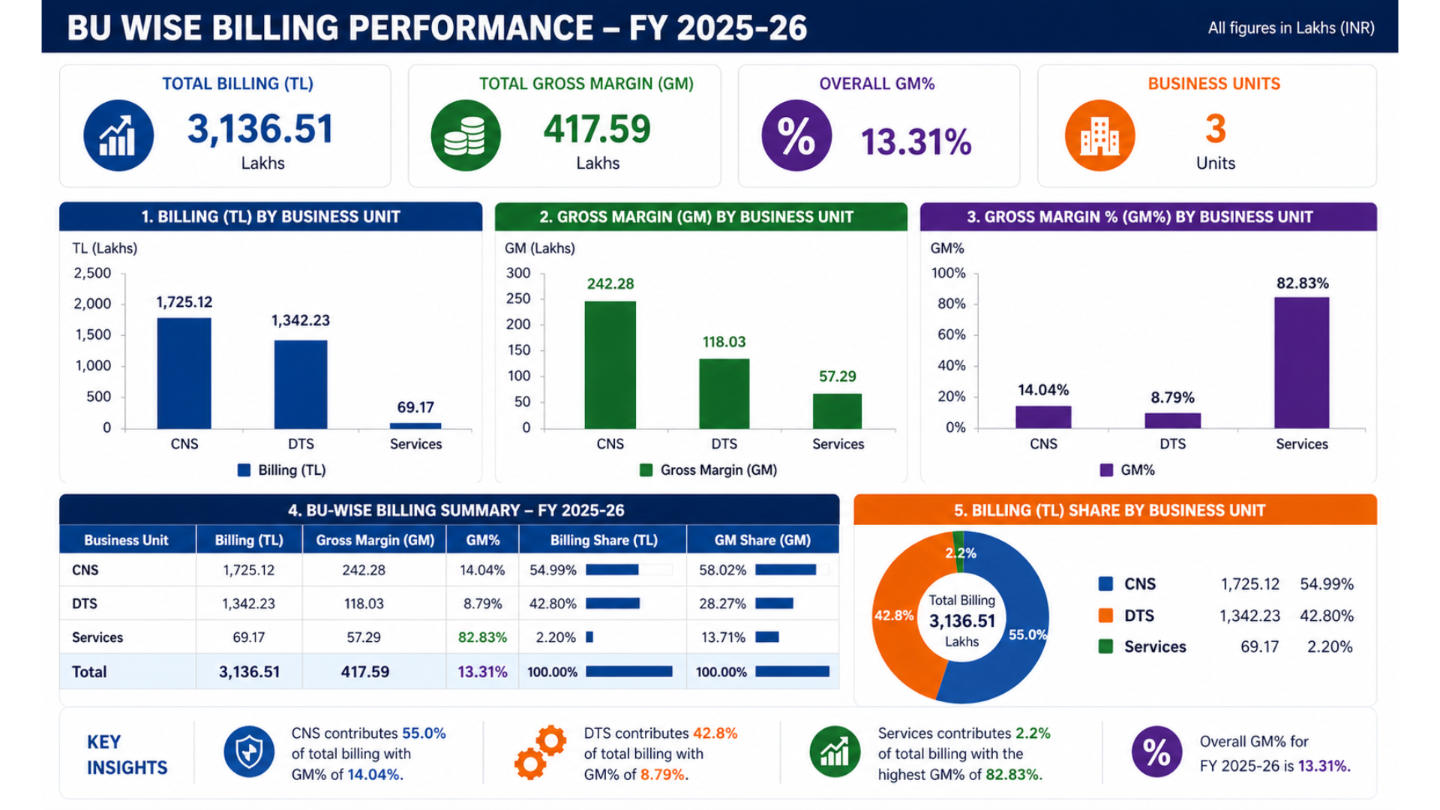
Business Unit Billing Performance
Project details
Management reporting view from the April presentation, covering booking, margin or planning.
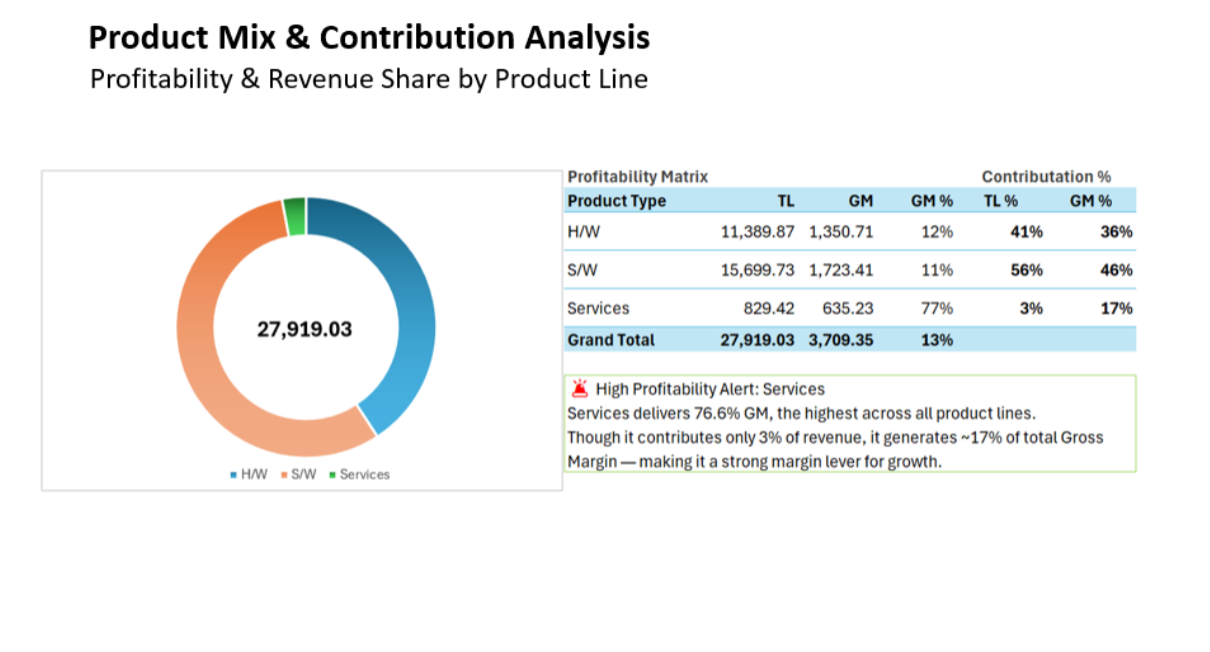
Product Mix and Profitability Dashboard
Project details
Understand revenue share and gross margin across hardware, software and services.
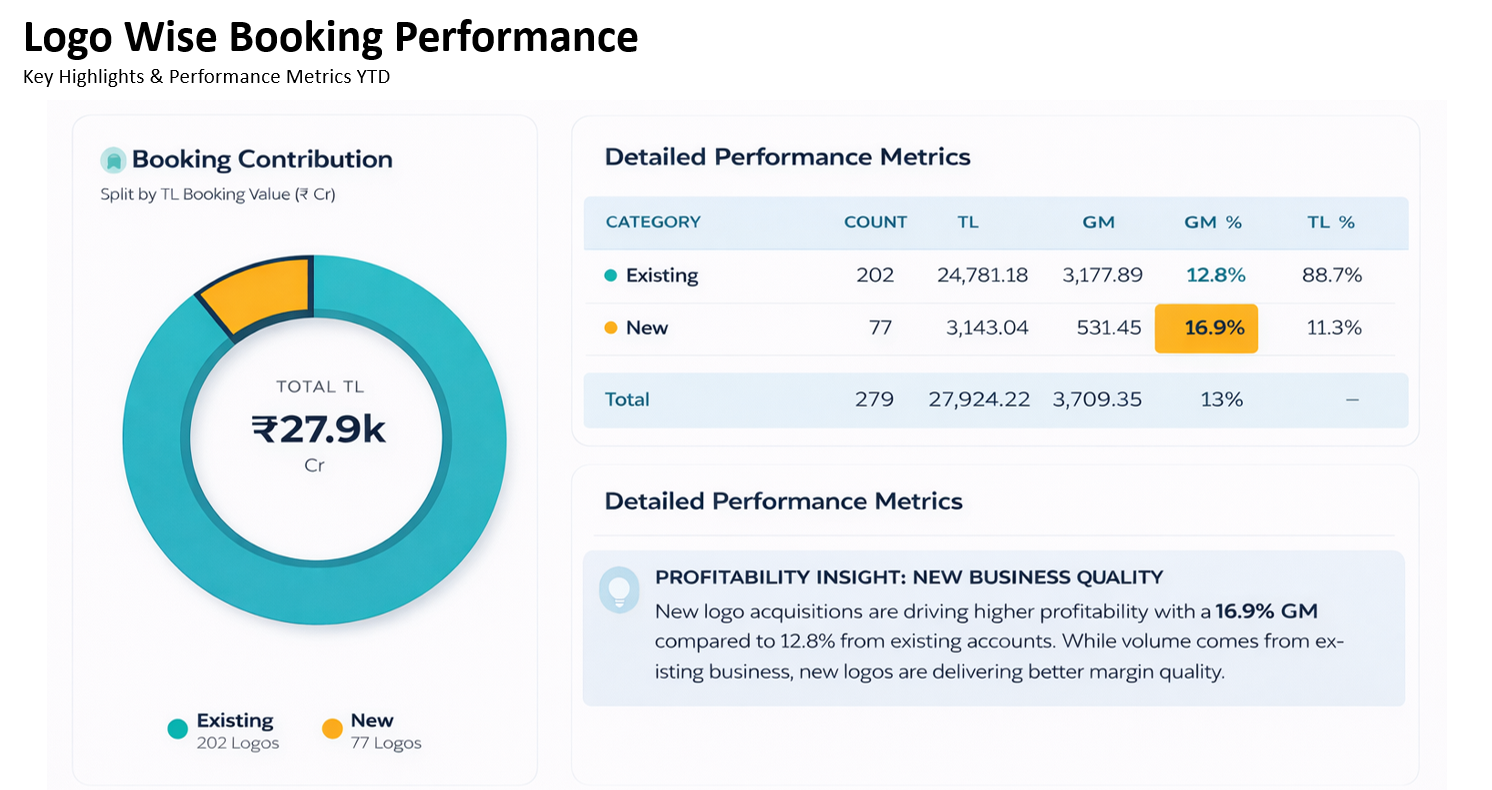
New and Existing Business Dashboard
Project details
Compare customer counts, booking contribution and margin between new and existing business.
More Dashboard Designs
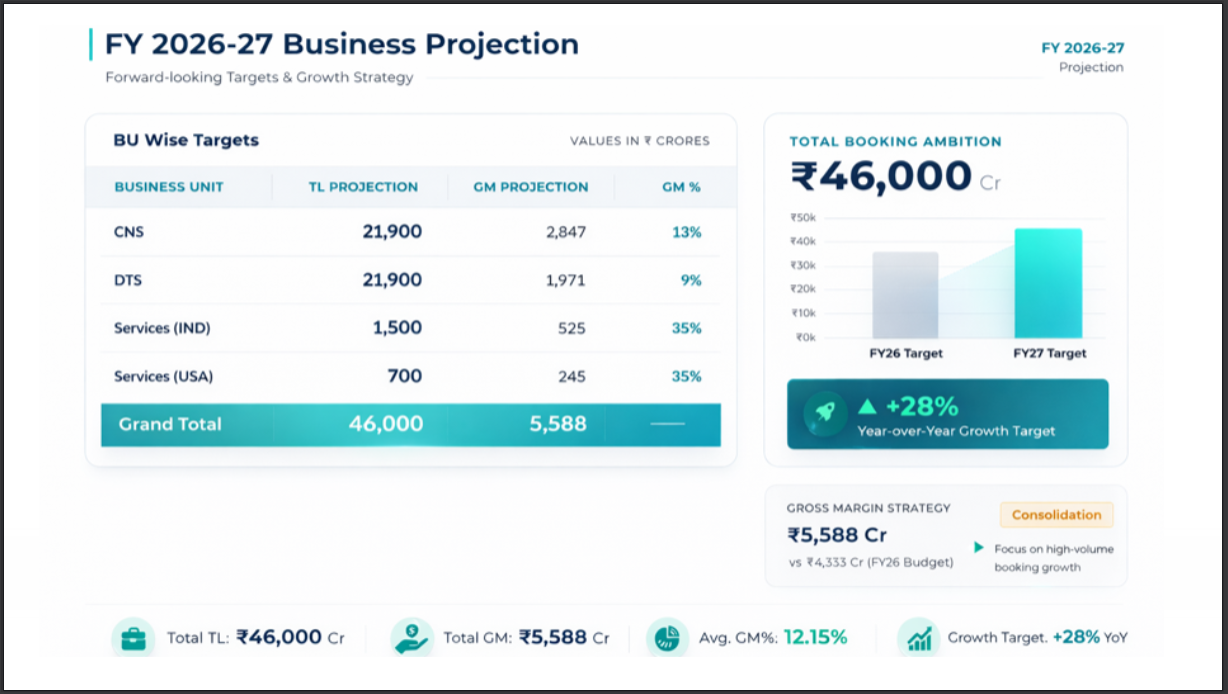
Business Projection Dashboard
Project details
Business unit targets, projected booking value, gross margin and growth in one management view.
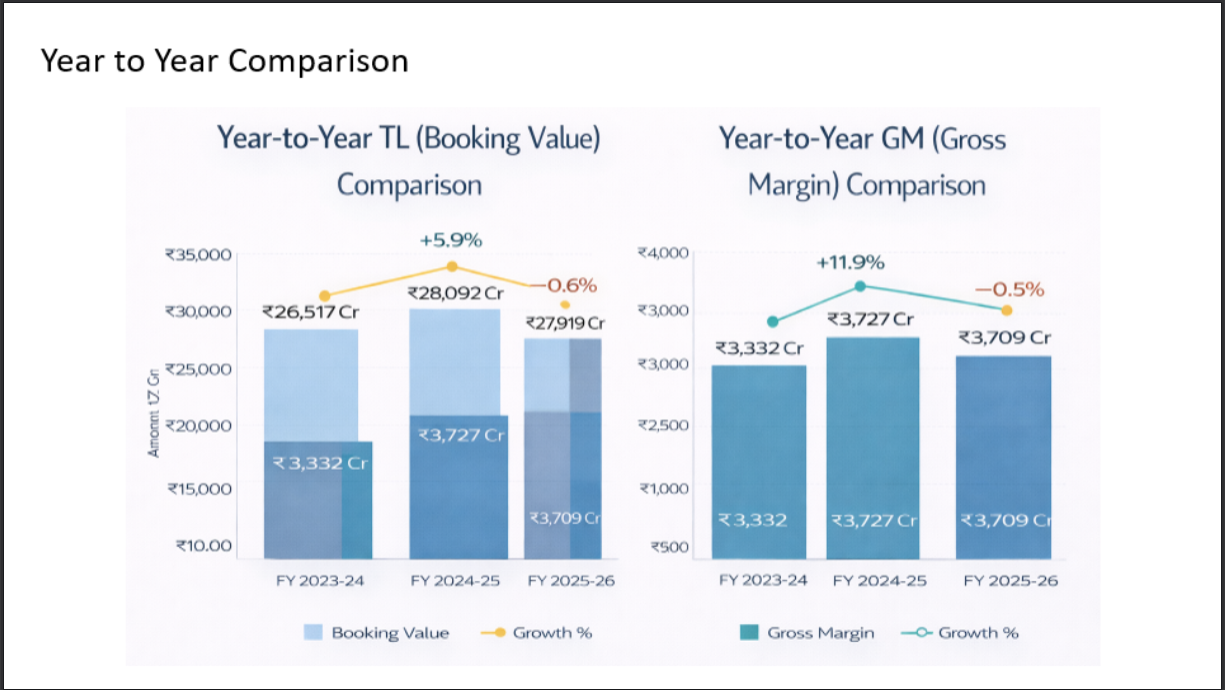
Year-on-Year Performance Dashboard
Project details
Compare booking value and gross margin across financial years, with growth indicators.
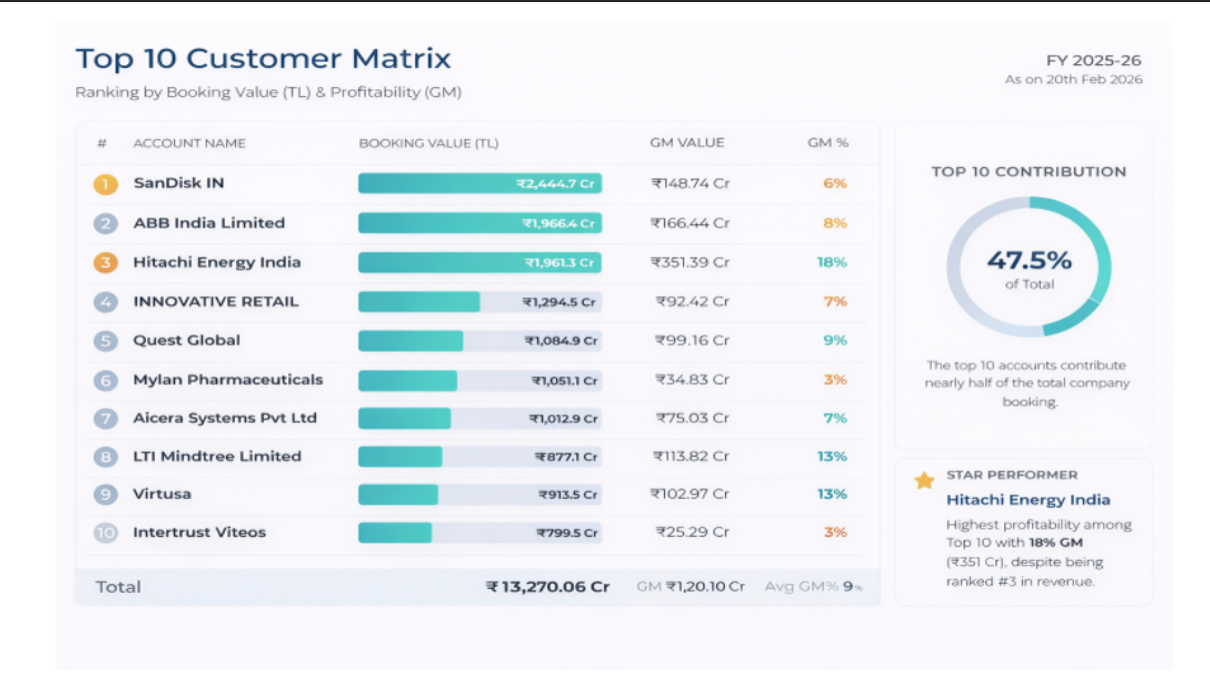
Customer Contribution Dashboard
Project details
Review leading accounts by booking value, profitability and contribution.
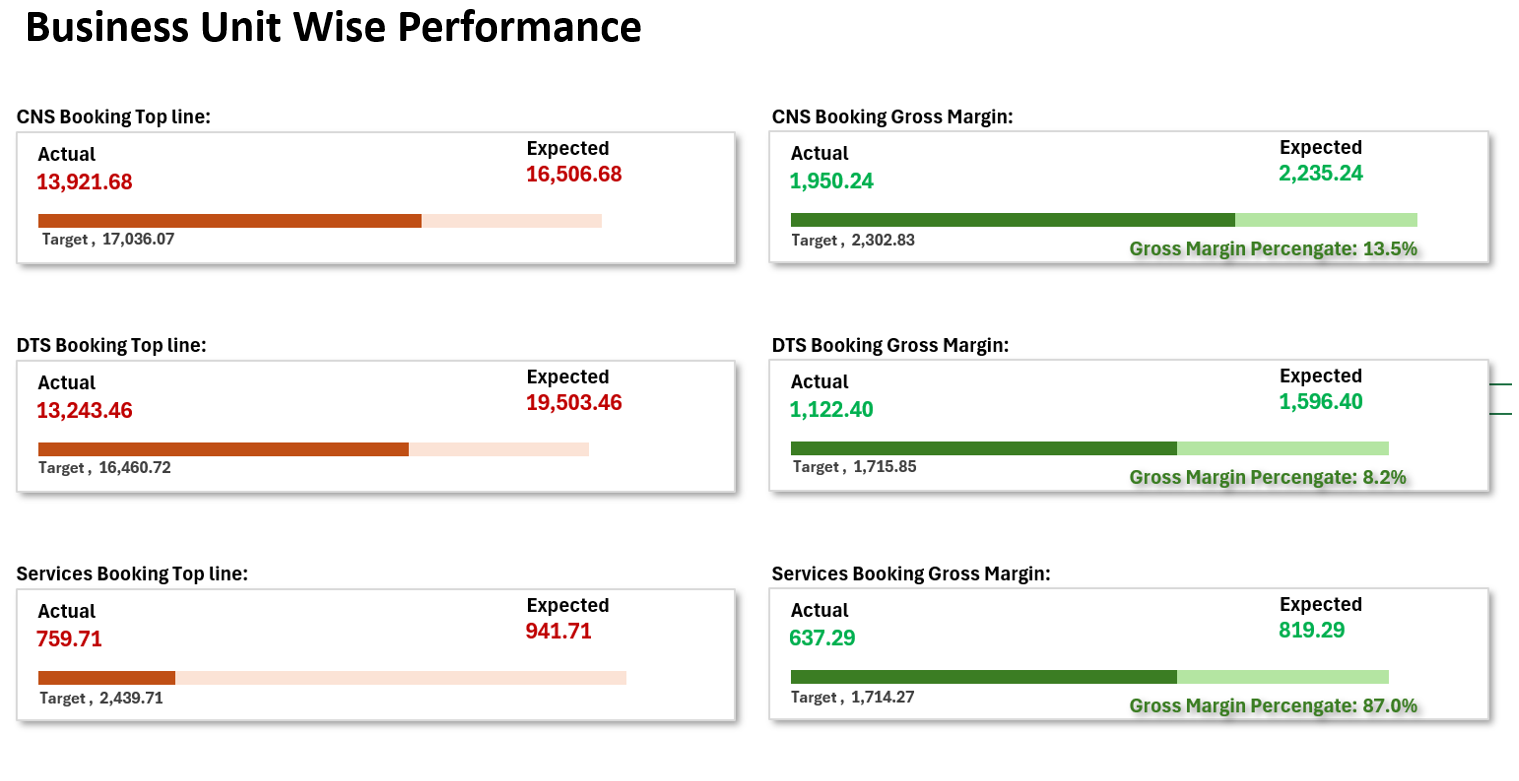
Business Unit Performance Dashboard
Project details
Compare actual, expected and target booking value and gross margin across business units.
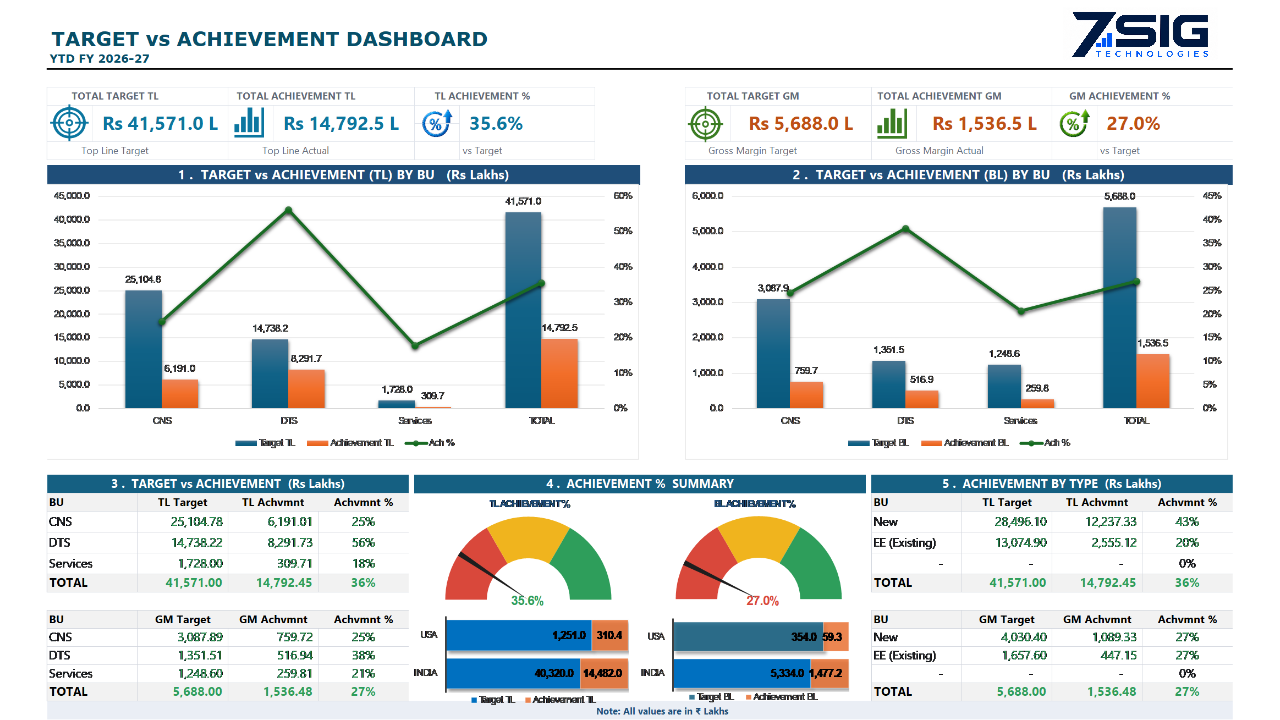
YTD Target vs Achievement
Project details
Management reporting view from the August presentation, covering performance, targets or pipeline.
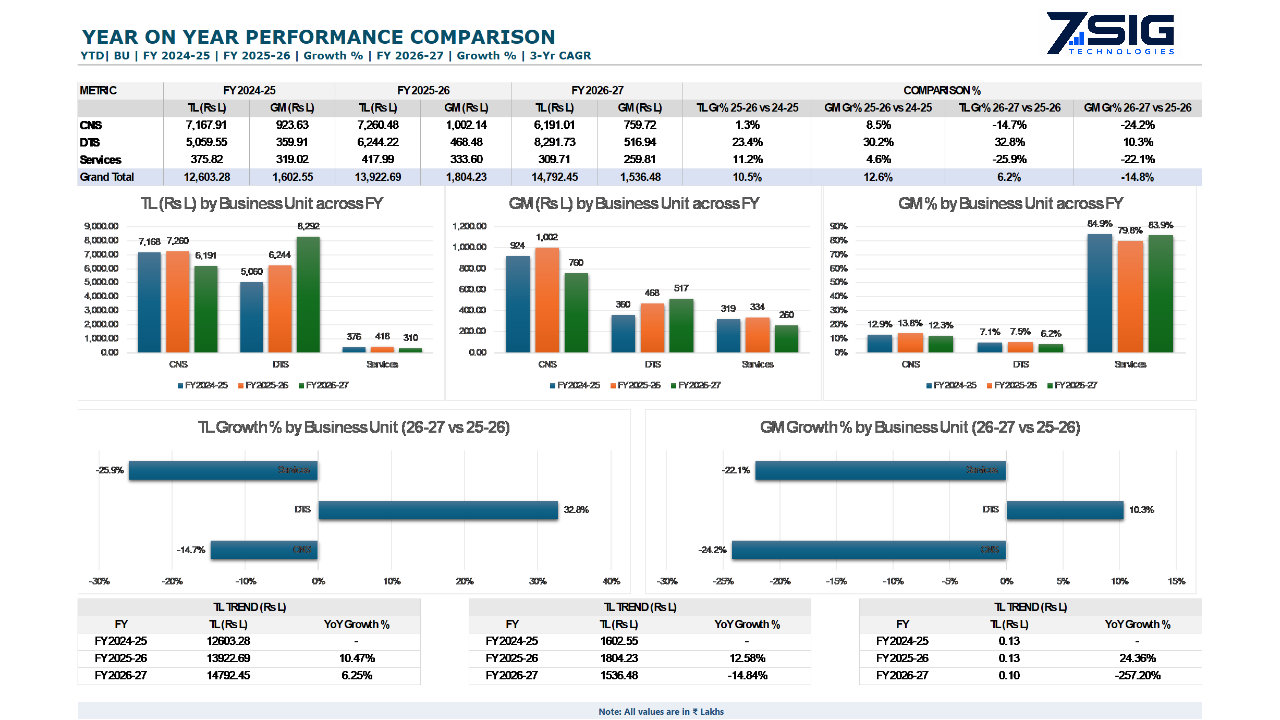
YTD Year-on-Year Comparison
Project details
Management reporting view from the August presentation, covering performance, targets or pipeline.
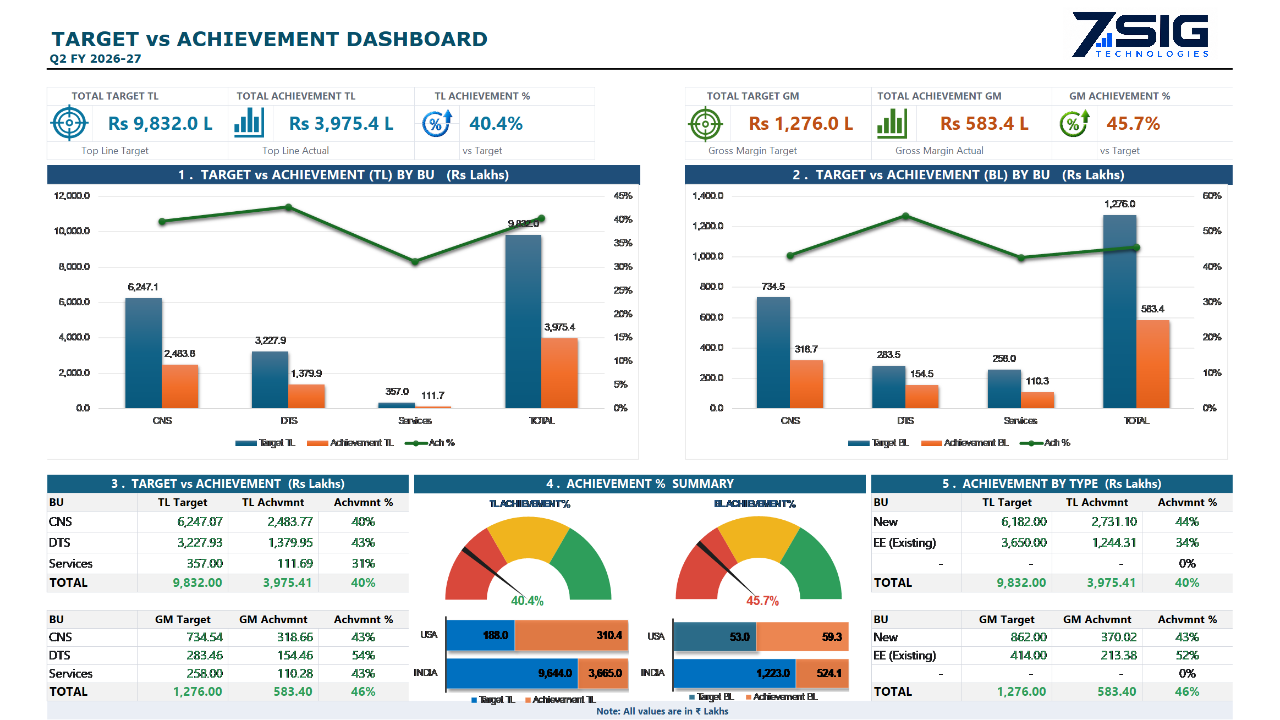
Q2 Target vs Achievement
Project details
Management reporting view from the August presentation, covering performance, targets or pipeline.
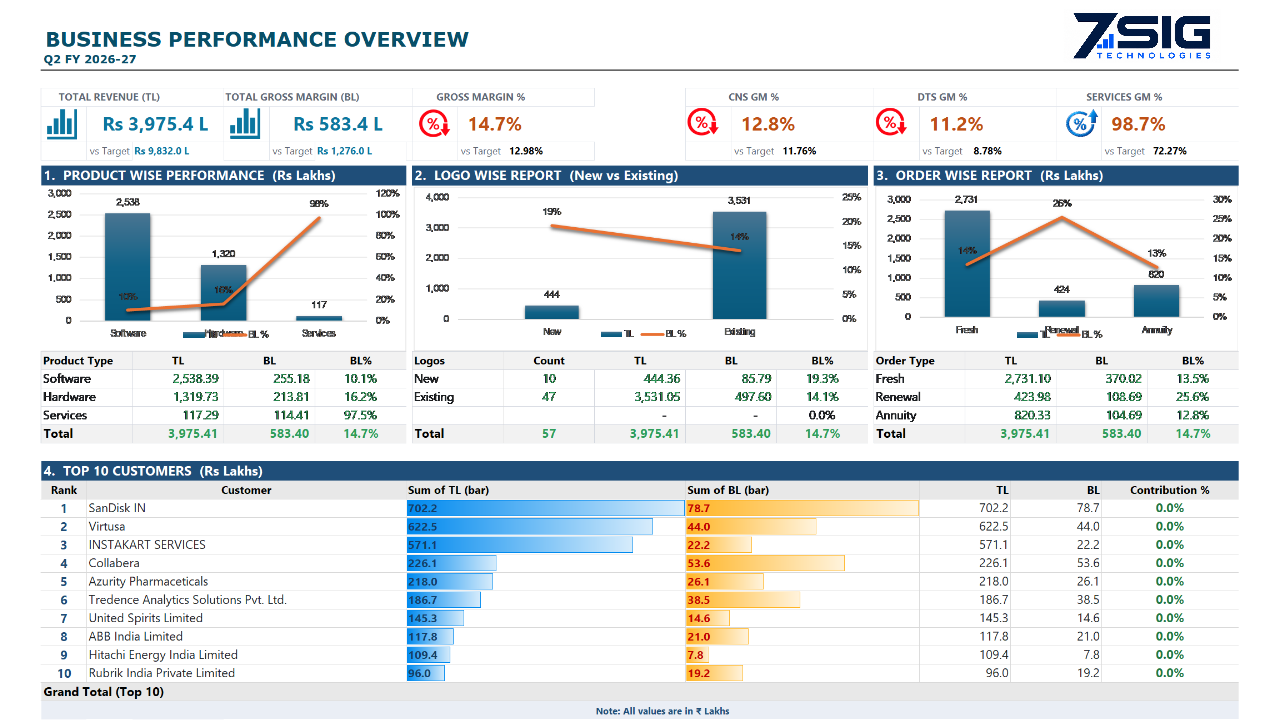
Q2 Business Performance Overview
Project details
Management reporting view from the August presentation, covering performance, targets or pipeline.
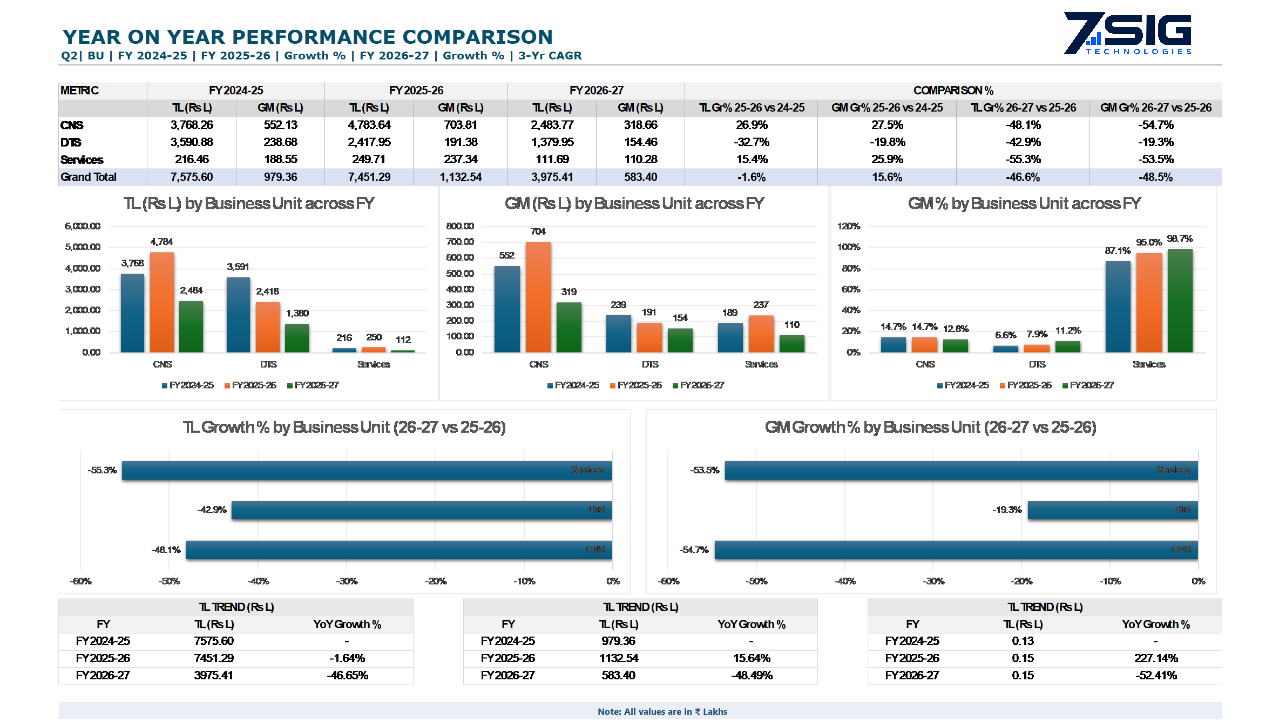
Q2 Year-on-Year Comparison
Project details
Management reporting view from the August presentation, covering performance, targets or pipeline.
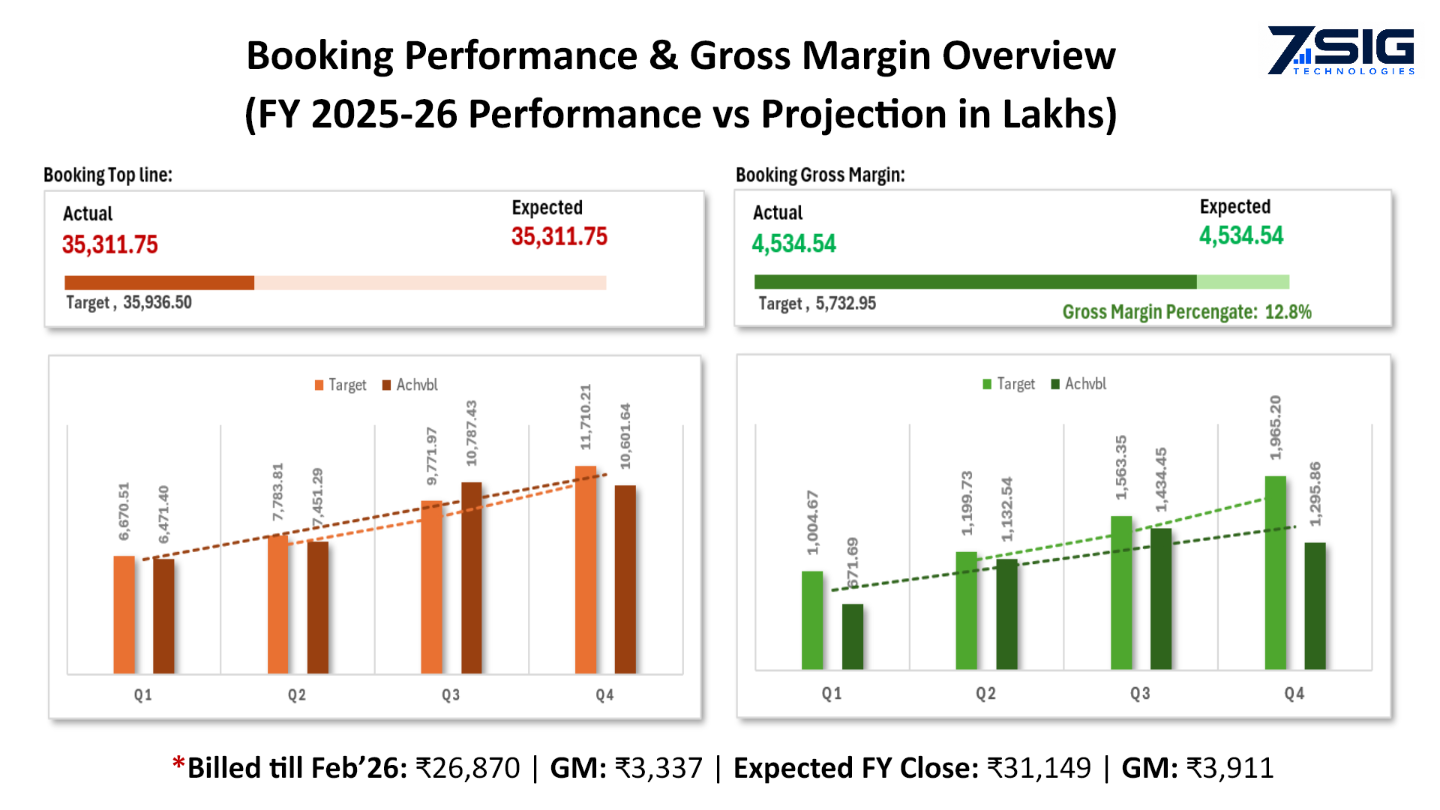
Booking Performance and Gross Margin
Project details
Management reporting view from the April presentation, covering booking, margin or planning.
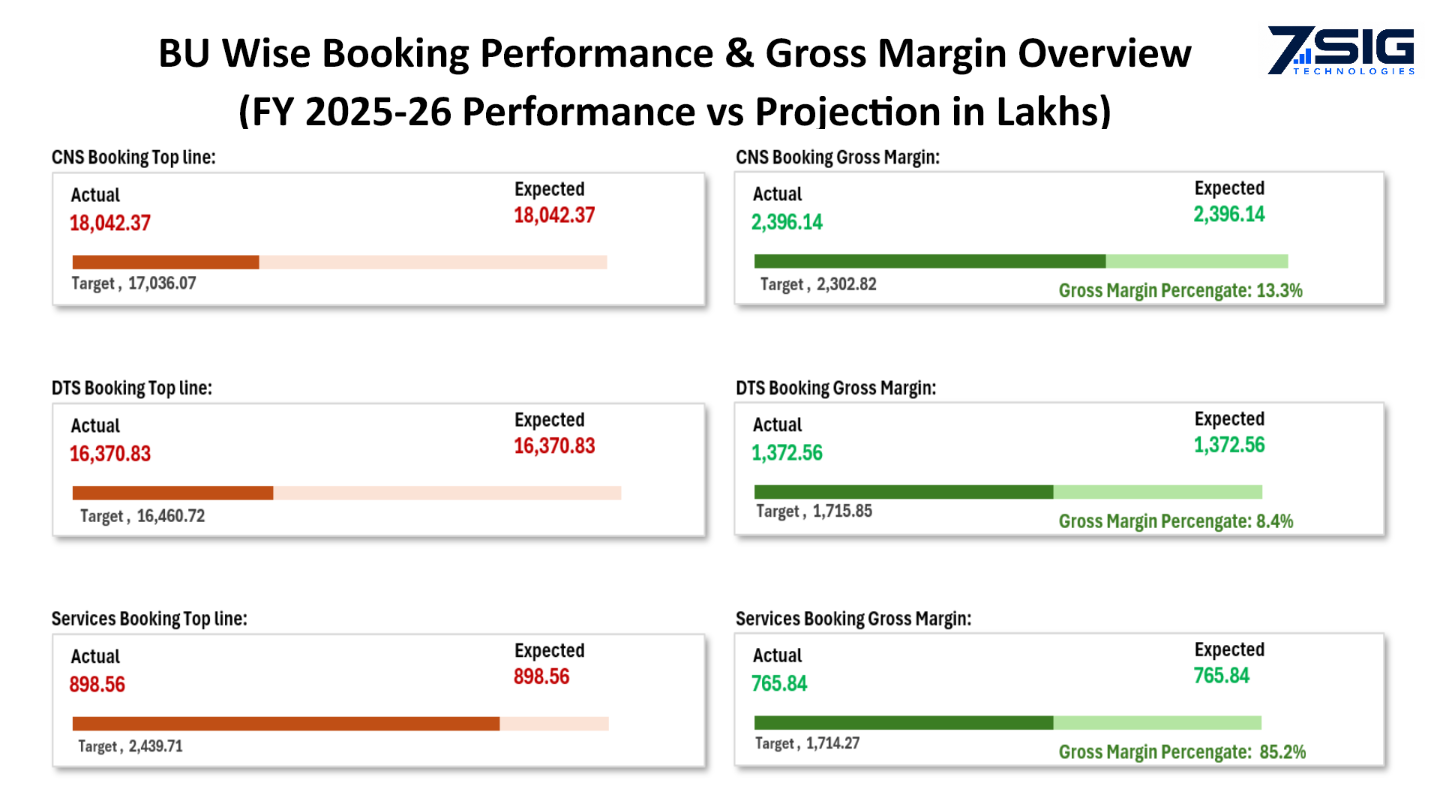
Business Unit Booking Performance
Project details
Management reporting view from the April presentation, covering booking, margin or planning.
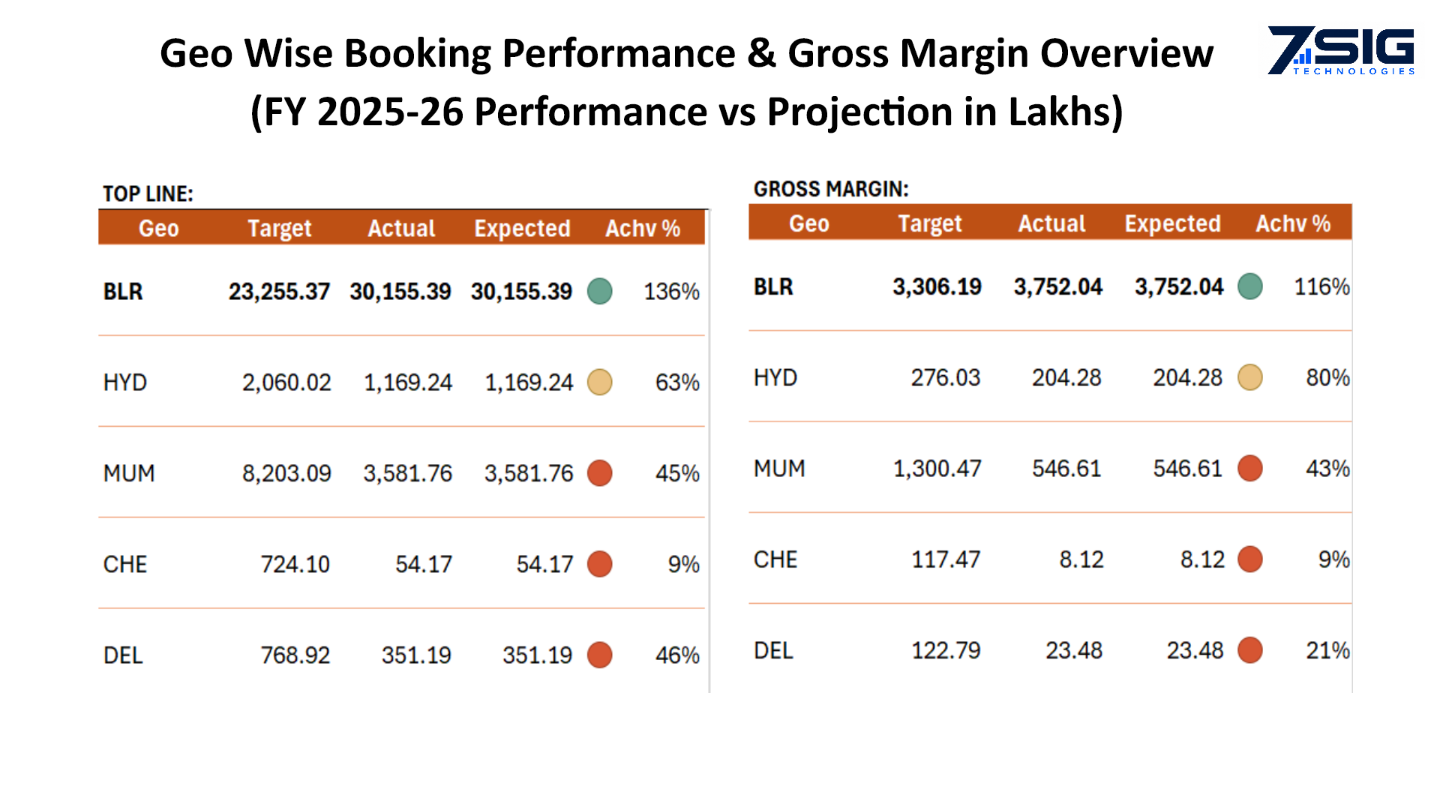
Geographic Booking Performance
Project details
Management reporting view from the April presentation, covering booking, margin or planning.
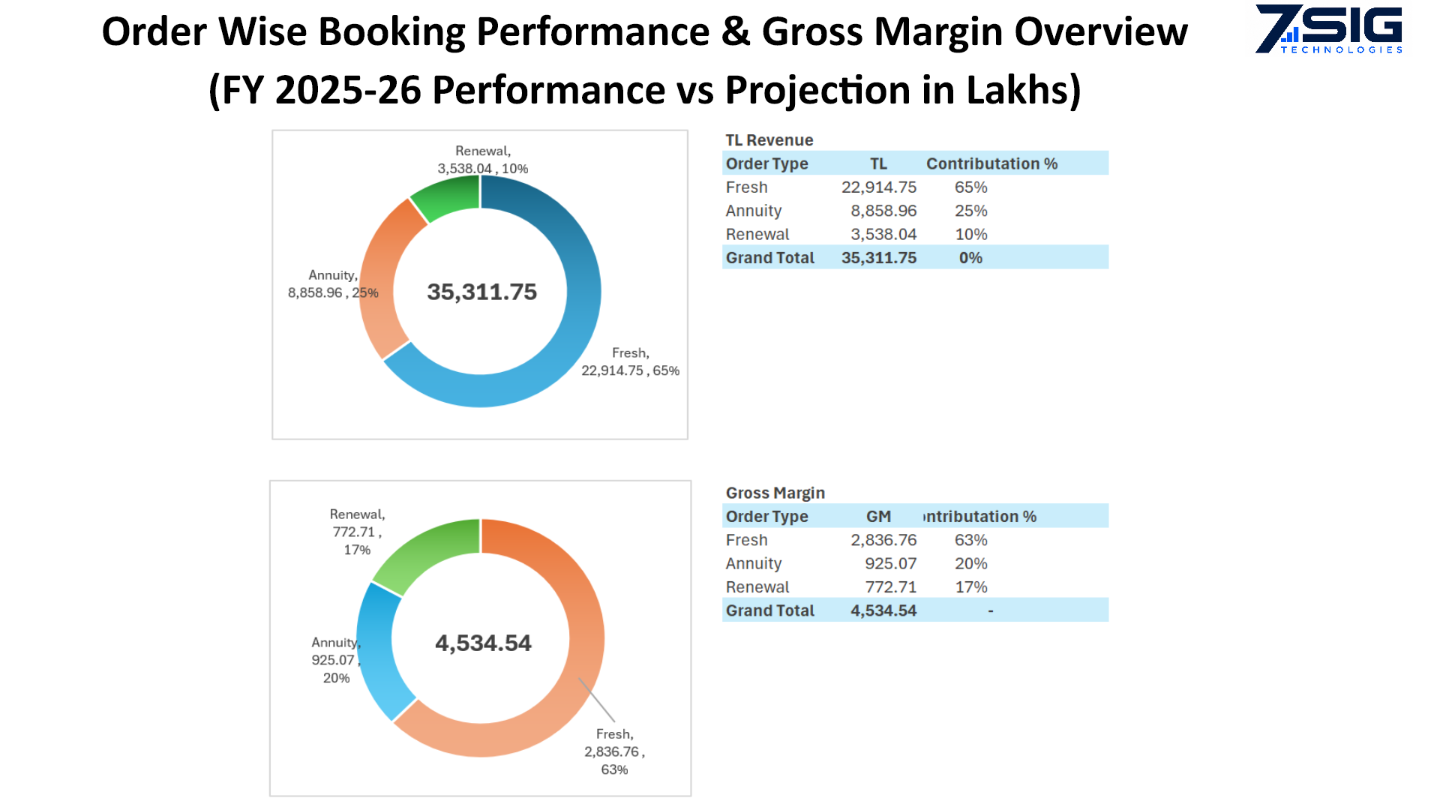
Order Type Performance
Project details
Management reporting view from the April presentation, covering booking, margin or planning.
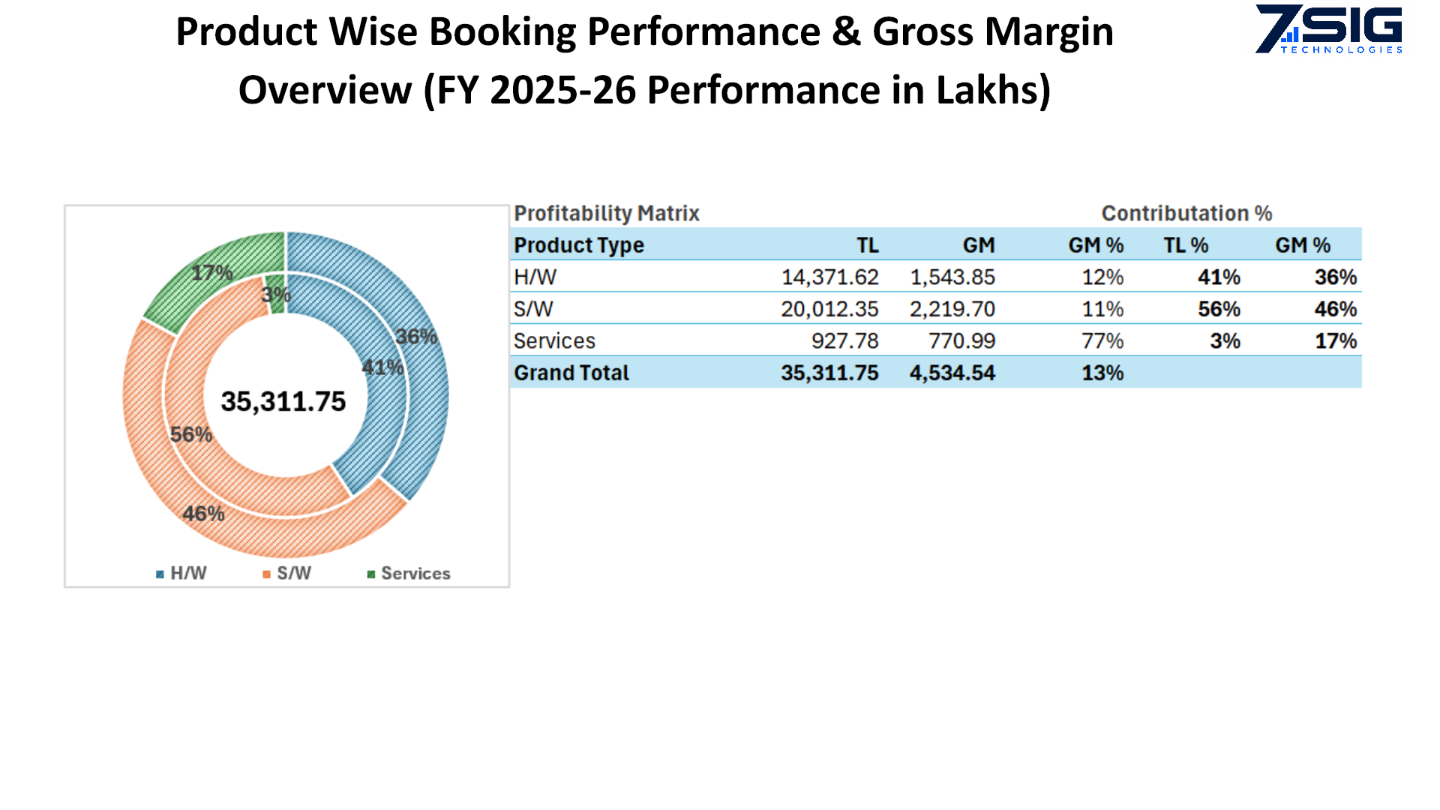
Product Mix and Contribution
Project details
Management reporting view from the April presentation, covering booking, margin or planning.
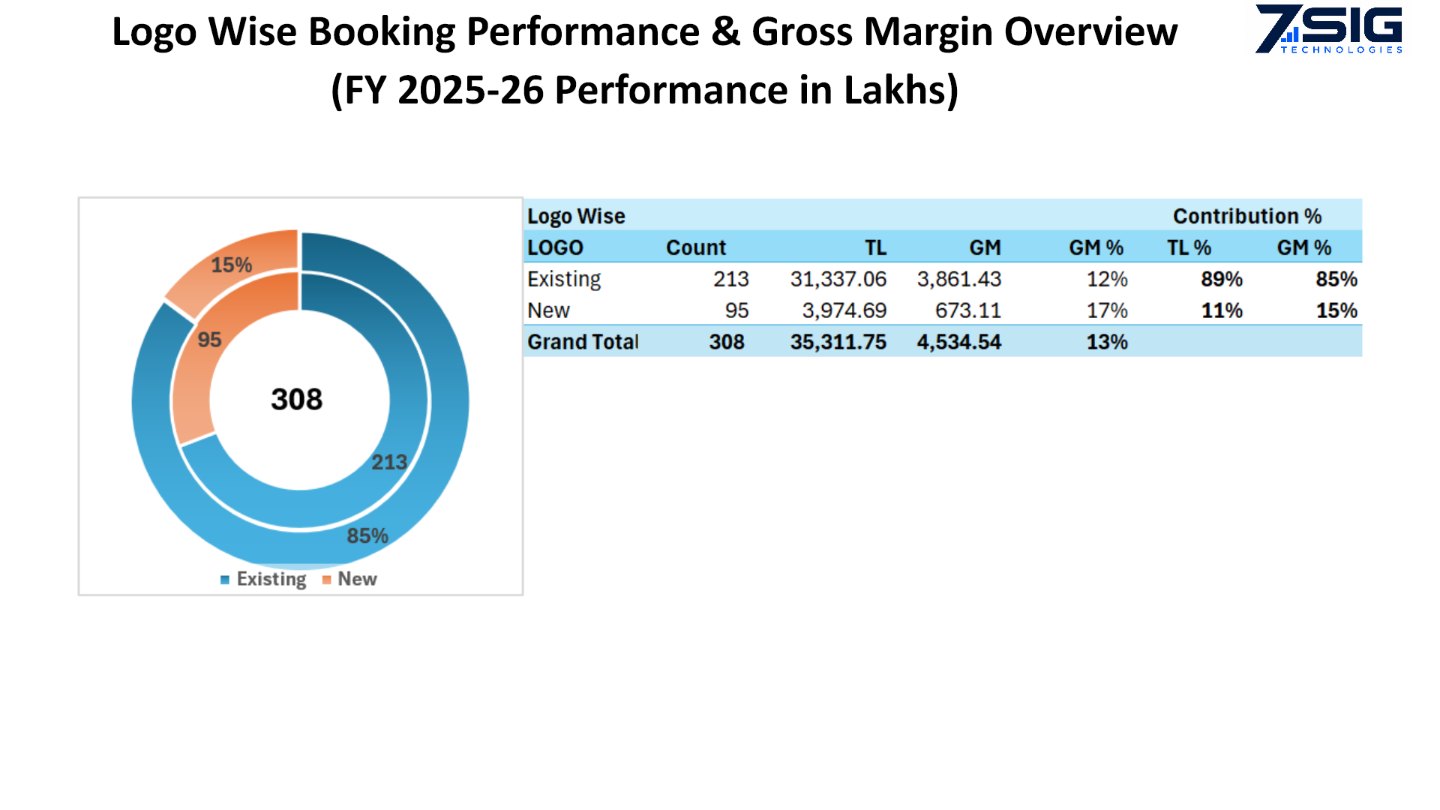
New and Existing Customer Performance
Project details
Management reporting view from the April presentation, covering booking, margin or planning.
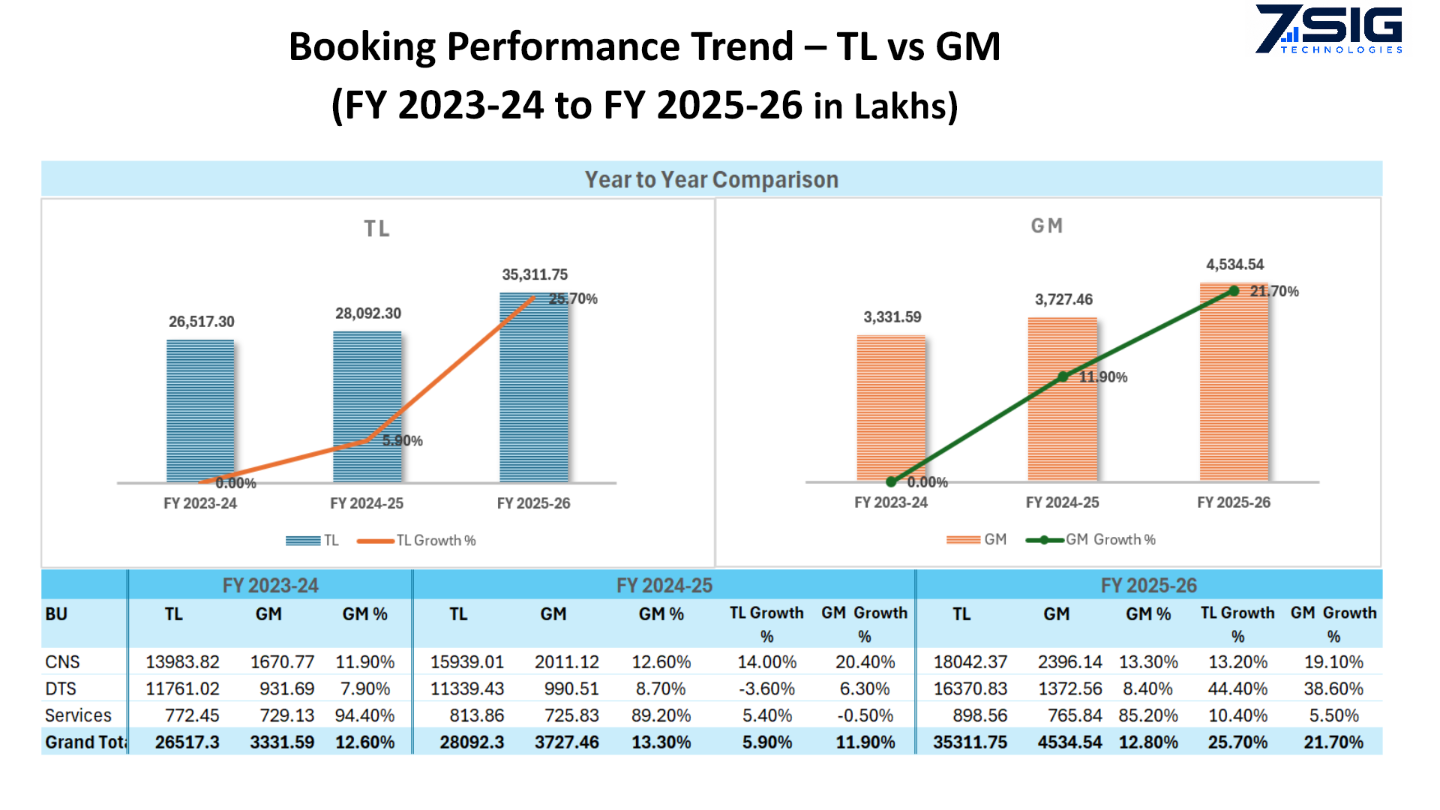
Three-Year Booking Trend
Project details
Management reporting view from the April presentation, covering booking, margin or planning.
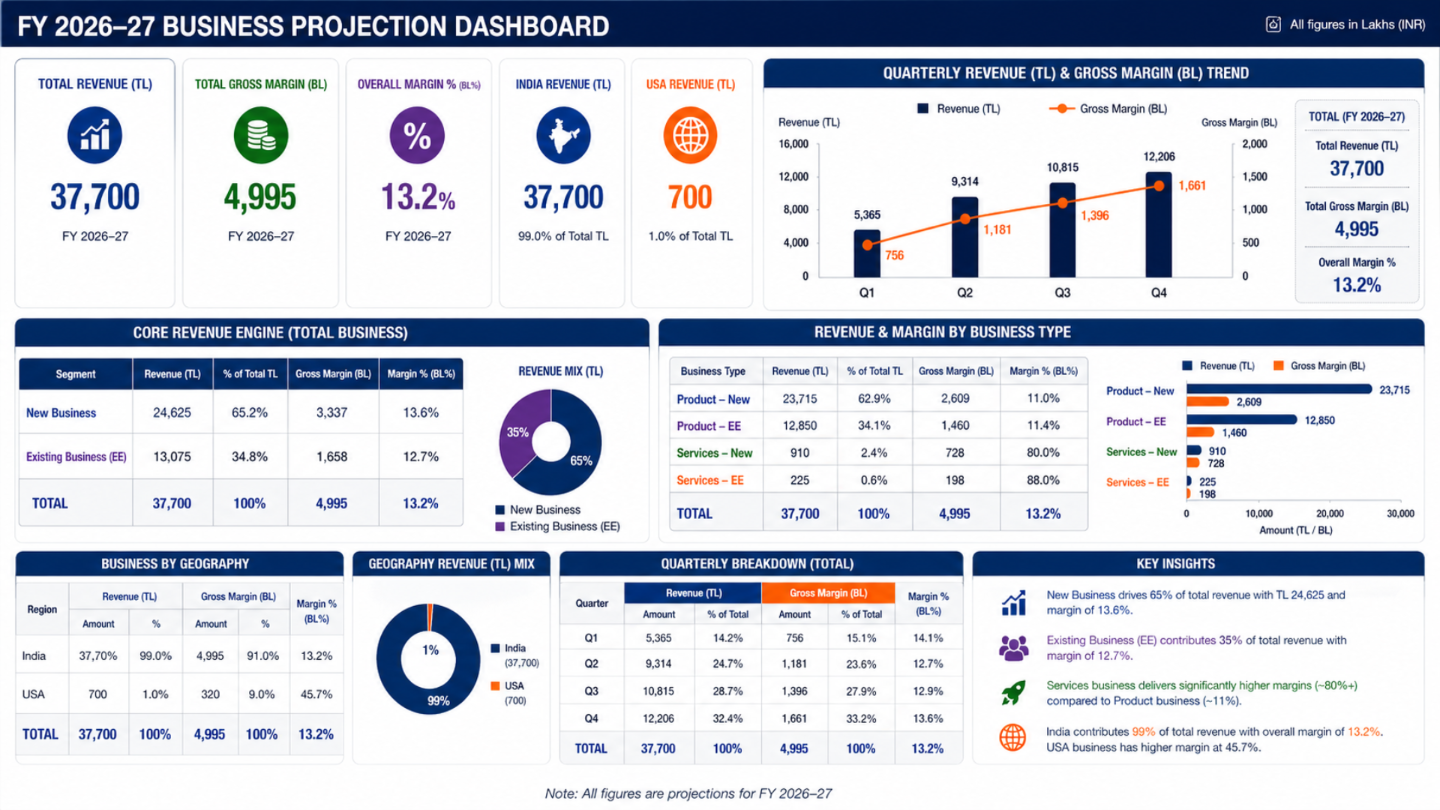
Business Projection Overview
Project details
Management reporting view from the April presentation, covering booking, margin or planning.
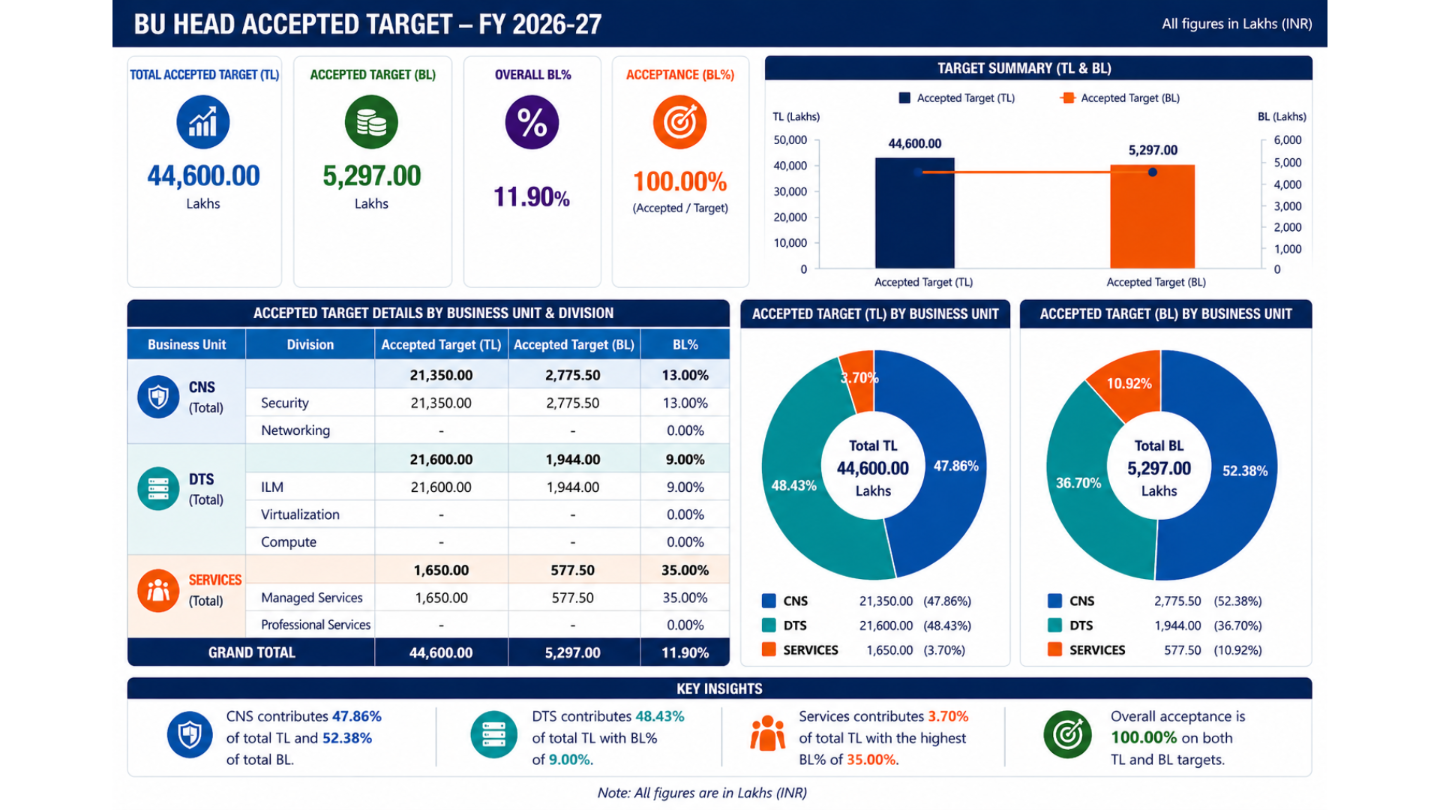
Accepted Target Overview
Project details
Management reporting view from the April presentation, covering booking, margin or planning.
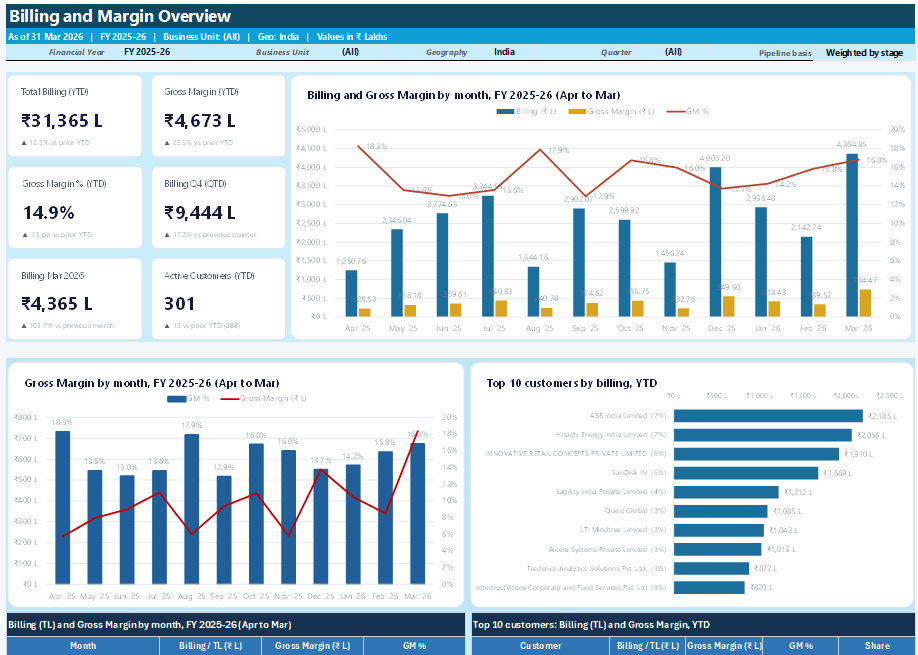
Billing and Margin Overview
Project details
Monthly billing, gross margin, customer contribution and financial performance for FY 2025–26.
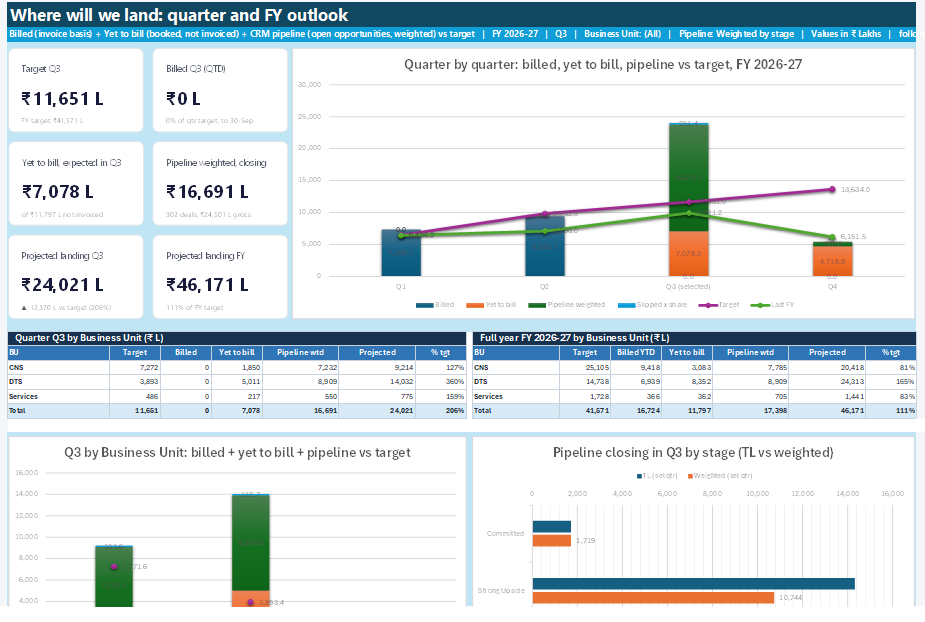
Quarter and Financial Year Outlook
Project details
Quarter and full-year projections combining billed revenue, yet-to-bill amounts and weighted sales pipeline against targets.
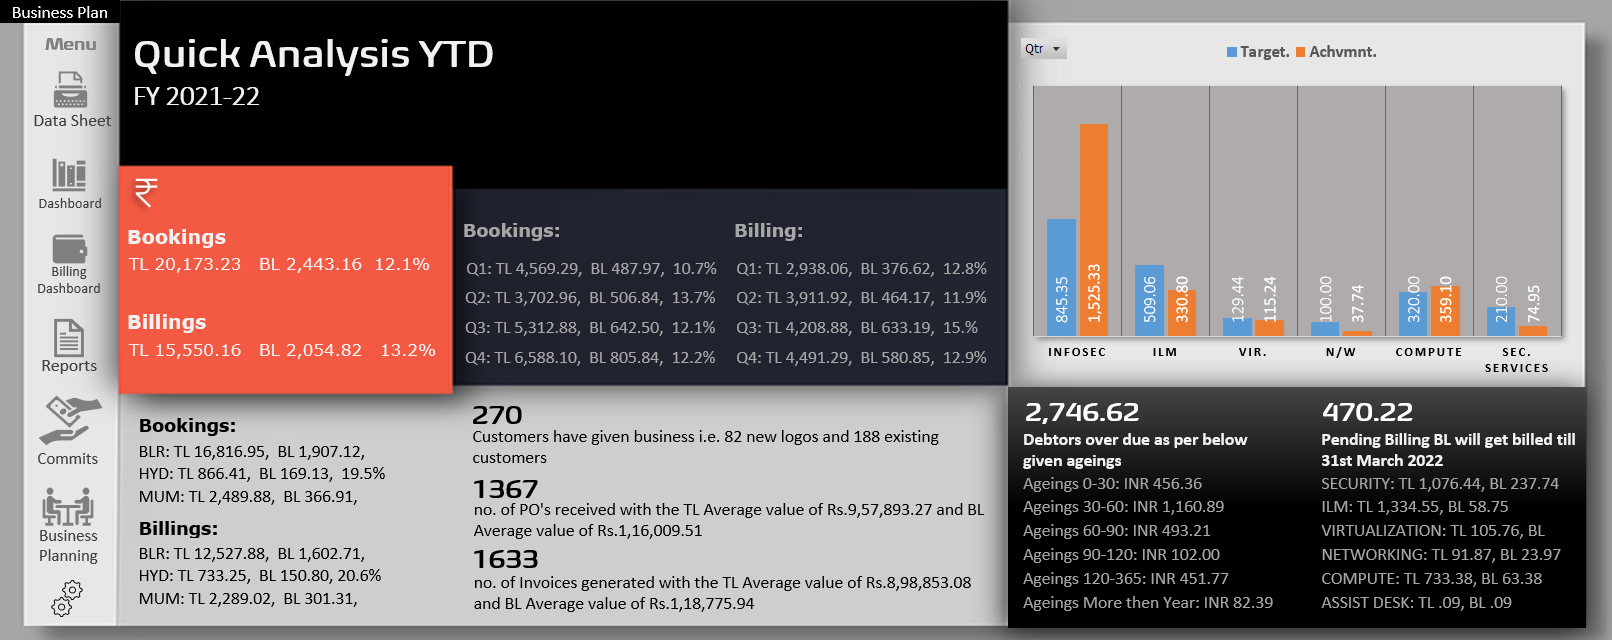
Quick Analysis YTD
Project details
A consolidated YTD view of bookings, billing, business units, customers, receivables and pending invoices.
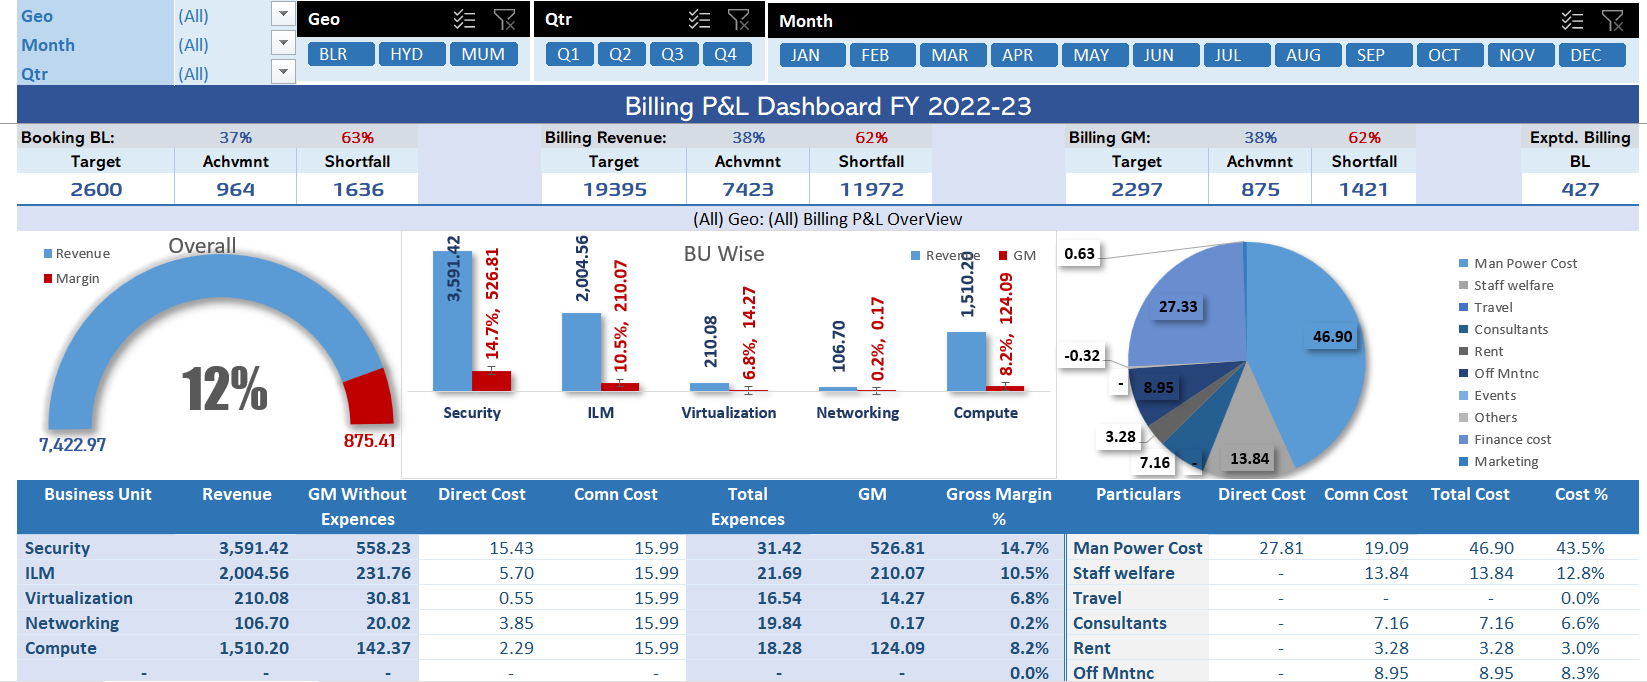
Billing P&L Dashboard
Project details
Billing revenue, gross margin, business unit performance and expense distribution with geography, quarter and month filters.
Team & Project Reporting
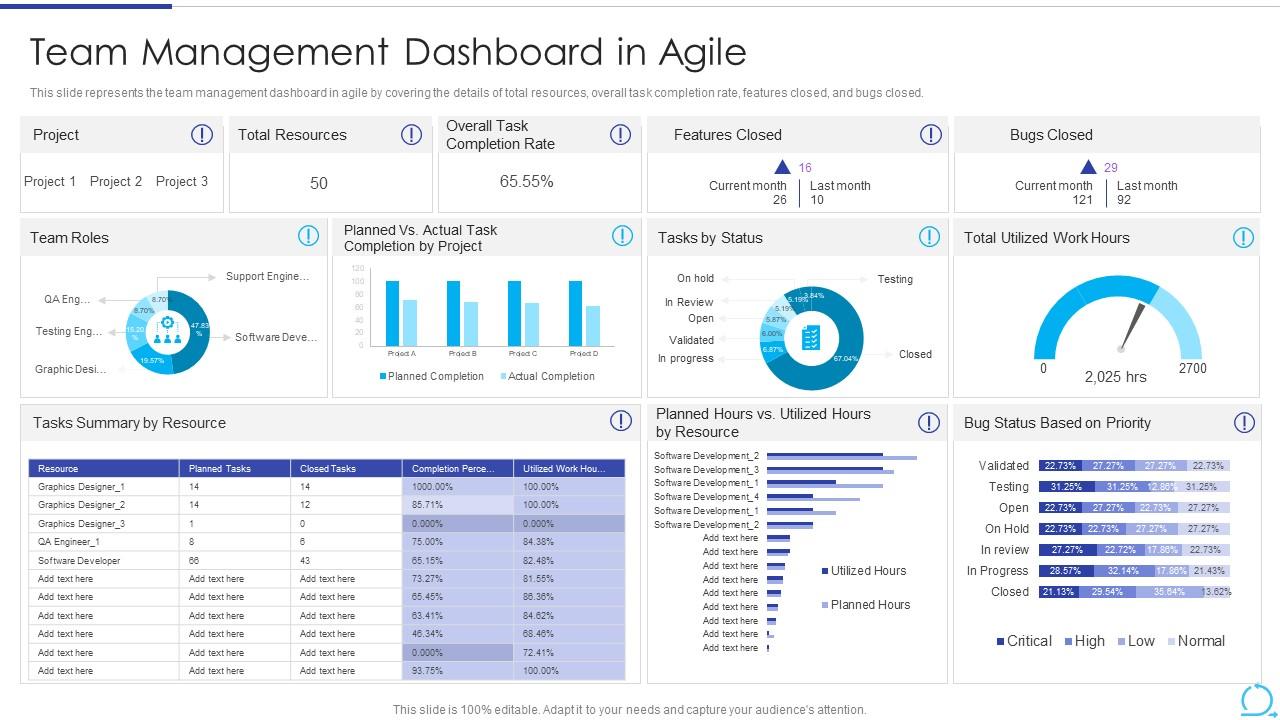
Agile Team Management Dashboard
Project details
Review resources, task completion, work hours, features and bug status.
Build a dashboard around your business
Share your reporting goals, data sources and key measures with 7SIG.
Discuss your requirements